


MLB pitchers have a ridiculous number of tools at their disposal. They throw triple-digit fastballs, rip high-spin breaking balls, and show off pinpoint command. Although these are the most visible – and most easily quantified – weapons in a pitcher’s arsenal, deception also plays a significant role in pitcher effectiveness.
And yet, not many publicly available resources measure “pitch tunneling”, which has long been considered the primary form of deception for pitchers.
More great Fantasy Baseball Analysis: Fantasy Baseball Waiver Wire | Weekly SP Rankings | Pitching Streamers | Two-Start Pitchers | Hitting Planner | Lineup Analysis | MLB Injury Report | Risers and Fallers | Prospect Report | Advanced Stats | Under the Radar | Overvalued & Undervalued
What is Pitch Tunneling?
Pitch tunneling consists of throwing two pitches that begin on a similar trajectory – in a similar “tunnel” – before diverging. The goal is to make two pitches look indistinguishable from one another until after the batter has decided to swing or not, forcing a whiff or weak contact.
For those who do it well, pitch tunneling is believed to bring significant benefits; in this interview with PitchingNinja (otherwise known as Rob Friedman), Pirates starter Paul Skenes explains how doing so can eliminate “waste” pitches. Said offerings – often thrown in 0-2 counts – aren’t competitive enough for the hitter to consider swinging.
As Skenes says, a non-competitive pitch can be effective if the following offering follows a similar initial trajectory before diverging into the strike zone for a called strike.
Pitches that land in the strike zone – often fastballs – are also perfect setup pitches for secondary pitches that appear to be headed on the same path only to fall out of the strike zone and induce a swing-and-miss.
Former Work on Pitch Tunneling
Despite being recognized as a valuable way to increase deception, tunneling data is significantly more difficult to find than raw metrics about a pitcher’s velocity or spin. Groundbreaking work on pitch tunneling – both in 2018 and earlier this season – has been done by the people at Baseball Prospectus, and they host a variety of tunneling-related statistics. If interested, I highly recommend checking out their data and methodology.
Additionally, independent studies have been performed on pitch tunneling. This paper was written in part by Maxwell Weinstein, who now works for the Dodgers in baseball operations. In it, he outlines baseball physicist Alan Nathan’s nine-parameter model for estimating pitch trajectory from Statcast’s release point data. Nathan’s model, as outlined by Weinstein, was incredibly helpful for estimating pitch trajectory in the model I used for this project.
Introducing Trajectory Deception Ratio (TDR)
Many of the current studies on pitch tunneling measure the difference between two pitches at release, at the “tunneling point” – defined in this Baseball Prospectus article as roughly 23.8 feet from home plate – and at arrival.
The idea for this project comes from the fact that hitters do not view pitches in only three, instantaneous locations. Rather, they track the pitch from the pitcher’s hand and use all the information they have about the trajectory of the pitch to make a decision. It makes sense, then, that capturing the total difference in the trajectory of two pitches would be an interesting and potentially useful way to quantify pitch tunneling.
That’s what I’ve done in this project using integrals, which allow us to measure the total three-dimensional pitch separation over time by adding up the separation during every instantaneous moment in a trajectory. The following is the root of the tunneling metric I’ve created, which I call TDR, or Trajectory Deception Ratio.
To understand how the metric is calculated, it’s important to understand the aforementioned pitch trajectory model created by Alan Nathan:
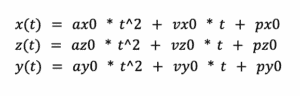
These three equations represent the position of the baseball at time t in three different directions: horizontal position relative to the catcher’s perspective (x), vertical position relative to the catcher’s perspective (z), and distance from the plate (y). The variables ax0, az0, and ay0 are the initial accelerations of the pitch in the respective directions. Similarly, vx0, vz0, and vy0 represent the initial velocities in each direction, and px0, pz0, and py0 are the initial release points in each of the three directions.
Now that we can calculate a pitch’s location in three different directions based on Statcast data, we just need a way to measure the distance between pitches based on the individual direction data. Using the Euclidean distance formula, we can do just that:

This formula allows us to find the distance in three-dimensional space between two pitches (denoted using a subscript in the equation) given their coordinates in each of the three directions described earlier.
Based on this knowledge,

d(t) is defined as the three-dimensional distance between any two pitches at time t. We found this by calculating the distance between the two pitches in each of the three dimensions, and then plugging them into the Euclidean distance formula.
Now that we know the separation between the two pitches at any time t based on initial pitch parameters, we can find the total pitch separation across any time interval from a to b using basic calculus.

By integrating the three-dimensional distance between the pitches over time, we are calculating the pitch separation at every instantaneous moment and then totaling them. For a visual, here is a graph of the distance between the Yoshinobu Yamamoto cutter-splitter tunnel shown in GIF format earlier:
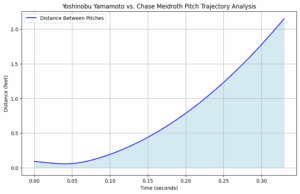
The blue line is the graphical representation of d(t), which represents the three-dimensional separation between pitches at any time t. The highlighted area under the curve shows the total difference in pitch separation as a function of time (the integral of d(t)).
In order to measure pitch tunneling, we need to find the ratio between pitch separation occurring early in ball flight and later in ball flight. It makes sense, then, to find the total distance between two pitches in the time before the decision point and after the decision point. The lower the ratio between these two values is, the more effectively a pitch was tunneled with the pitch prior to it.
Now that we have the setup of our pitch tunneling metric, we need to identify the point at which the batter has to make a swing decision. In this model, we’ll use the same value as in the aforementioned paper by Weinstein, which is .125 seconds after pitch release. Because a 105-MPH fastball thrown by a pitcher with 8 feet of extension – which would arrive at the plate faster than nearly any tracked pitch in MLB history – would take roughly 0.338 seconds to arrive at home plate with no air resistance, we will use 0.33 as the upper bound over which we will integrate the distance between the two pitches.
Since we are finding the difference in pitch distance as a function of time, both pitches have to be in the air across the interval over which we are integrating pitch separation. We could use the time-to-plate of the faster of the two pitches, but it is difficult to identify that exact value due to air resistance. For that reason, the model will only measure the distance between pitches up to 0.33 seconds after release.
Given these parameters, here is the formula for TDR:

For all the fancy calculations, TDR is simply a measure of the total separation between consecutive pitches over the first 0.125 seconds after release, divided by the total separation during the 0.205 seconds post-decision point.
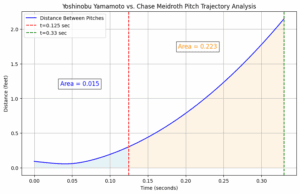
Video Overlay Breakdown
Using ChatGPT – which was also very useful for executing the mathematical concept – and Google Colab, I pulled the necessary trajectory parameters for every pitch thrown this season between Opening Day and July 6th using the pybaseball package. After processing over 400,000 pitches, the TDR for every consecutive pitch pair within the same batter was calculated and a pitcher leaderboard was created based on average TDR. Of those 408,880 pitches, only 303,187 were assigned a TDR because roughly a quarter of them came on the first pitch of the plate appearance.
According to the metric, these are the three best-tunneled pitch sequences in MLB this season:
#1: Zach Eflin vs. Zach Neto, May 11th (Top 3): Sinker-Fastball
Trajectory Deception Ratio: 0.039
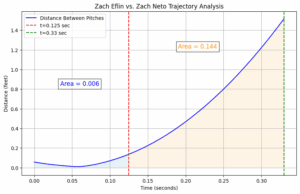
After throwing a sinker that started middle-middle and ended up on the inside-bottom corner of the zone, Eflin threw a four-seam fastball with identical mechanics and initial trajectory. Neto, who just saw the sinker drop, got jammed under the fastball and flew out to the center fielder.
#2: Will Warren vs. Carlos Narvaez, June 6th (Top 4): Fastball-Sinker
Trajectory Deception Ratio: 0.043
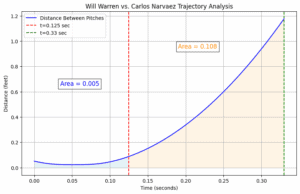
Warren threw the same two pitches as Eflin did, but in reverse order. Both ended up as called strikes against Red Sox catcher Carlos Narvaez.
#3: Jesus Luzardo vs. Pedro Pages, May 14th (Top 2): Changeup-Sweeper
Trajectory Deception Ratio: 0.045
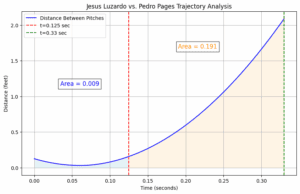
Luzardo perfectly tunneled two secondary pitches that move in opposite directions – a changeup and sweeper – and induced a swinging strike three from Cardinals catcher Pedro Pages.
Just to make sure this metric is working as intended, let’s take a look at the pitch TDR grades as the worst tunneling sequence of the season. Just 0.049% of pitches thrown this season had a TDR of at least 1.00, but this pitch registered at a whopping 2.57. That means this pitch and the one preceding it had over 2.5 times as much separation in the first .125 seconds as they did in the final .205 seconds.
This offering was thrown by Raisel Iglesias to Eugenio Suarez in the 9th inning of Suarez’s four-homer game. Take a look at the overlay with the prior pitch and the corresponding trajectory graph below:
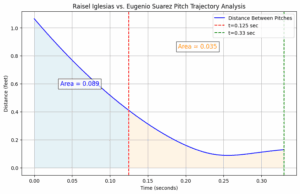 It’s clear to see that the two pitches were released extremely far apart, despite both being fastballs. They actually converge while on their way to the plate, which explains the extremely high ratio between initial and late separation.
Limitations
No metric is perfect, and TDR certainly isn’t. The following are limitations of the statistic, either in concept or in execution, that could be eliminated or researched further in the future.
- Multiple pitch tunneling studies – including at Baseball Prospectus and in the Weinstein paper referenced earlier – have considered the batter’s viewpoint in their respective models. Integration of pitch separation from the batter’s perspective is a potential improvement to this metric in the future.
- The model can’t measure the distance between pitches over the entire trajectory because properly integrating over the three-dimensional pitch separation requires both pitches to be in the air at every time t. Because time-to-plate varies so much between pitches, the upper bound for integration – and therefore tunneling measurement – was set at t=0.33 seconds.
While it does have its limitations, Trajectory Deception Ratio is an accurate and novel way to quantify pitch tunneling. Look out for more articles about TDR as we test the new metric quantitatively and evaluate players for both real-world and fantasy baseball purposes.
Fantrax is one of the fastest-growing fantasy sites in the fantasy sports industry, and we’re not stopping anytime soon. We are the most customizable, easy-to-use, and feature-rich platform in the industry, offering the greatest fantasy experience for your dynasty, keeper, redraft, and best ball leagues. Fantasy sports doesn’t sleep, and neither does Fantrax, with seasons running 365 days a year. Take your fantasy leagues to the next level now at Fantrax.com!